Published on: 01/22/2026
We are proud to announce the release of RF-DAP version 2025.4!
To improve your experience with our product, this release includes several enhancements, new features, and bug fixes. Check out the summary below of what’s new in Catalogue, Special Core Analysis Simulator (SCAS), Fluid Analysis and Simulation Environment (FASE) and Simulation of Thermodynamic Electrolyte Partitioning and Speciation (STEPS) modules.
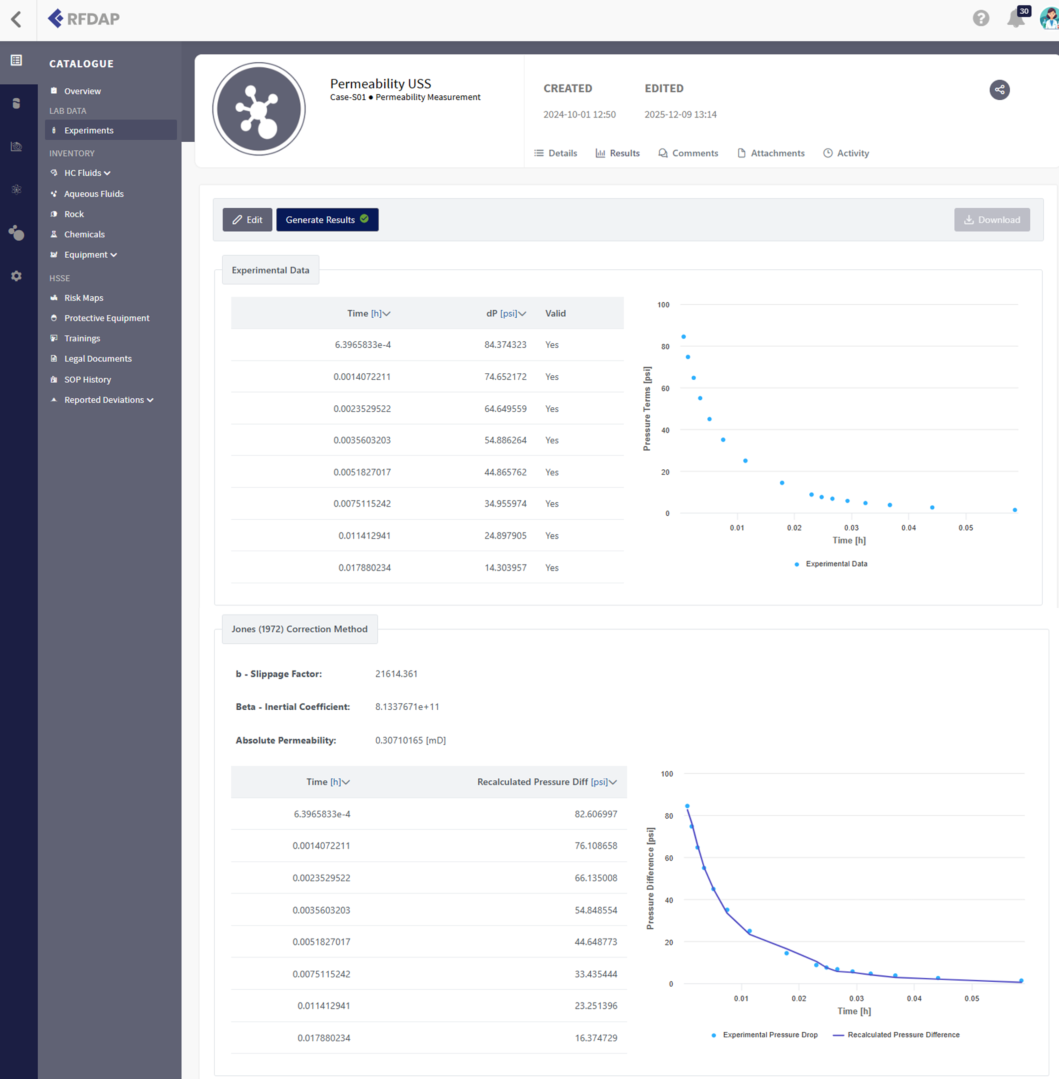
Permeability Experiment workflow is now improved to support the Unsteady State (USS) flow process. In the experiment Details, you can now choose between Steady State (SS) and USS (pulse-decay) methods. When USS is selected, results provide dedicated fields for experimental data input and the Jones (1972) Correction Method for more advanced permeability analysis, as shown in Figure 1.
Sample management has been expanded to better accommodate field data diversity. We now support Sidewall Core and Drilling Cuts rock sample shapes. Also, Extraction Locations have been enhanced with new fields, including Basin, Well API Code, and Well Completion Date, ensuring more robust tracking and categorization of your physical assets.
In complex coreflooding scenarios, setting accurate initial conditions is critical for simulation stability and realism. To address this, we have introduced support for Pressure Stages within the coreflooding experiment.
By using pressure as an input unit for flow stages, you can effectively define initial conditions for running Simulations and performing History Matching. This ensures that your calibrated models are built on physically consistent pressure-driven behavior rather than being limited to flow-rate-only constraints, as illustrated in Figure 2.

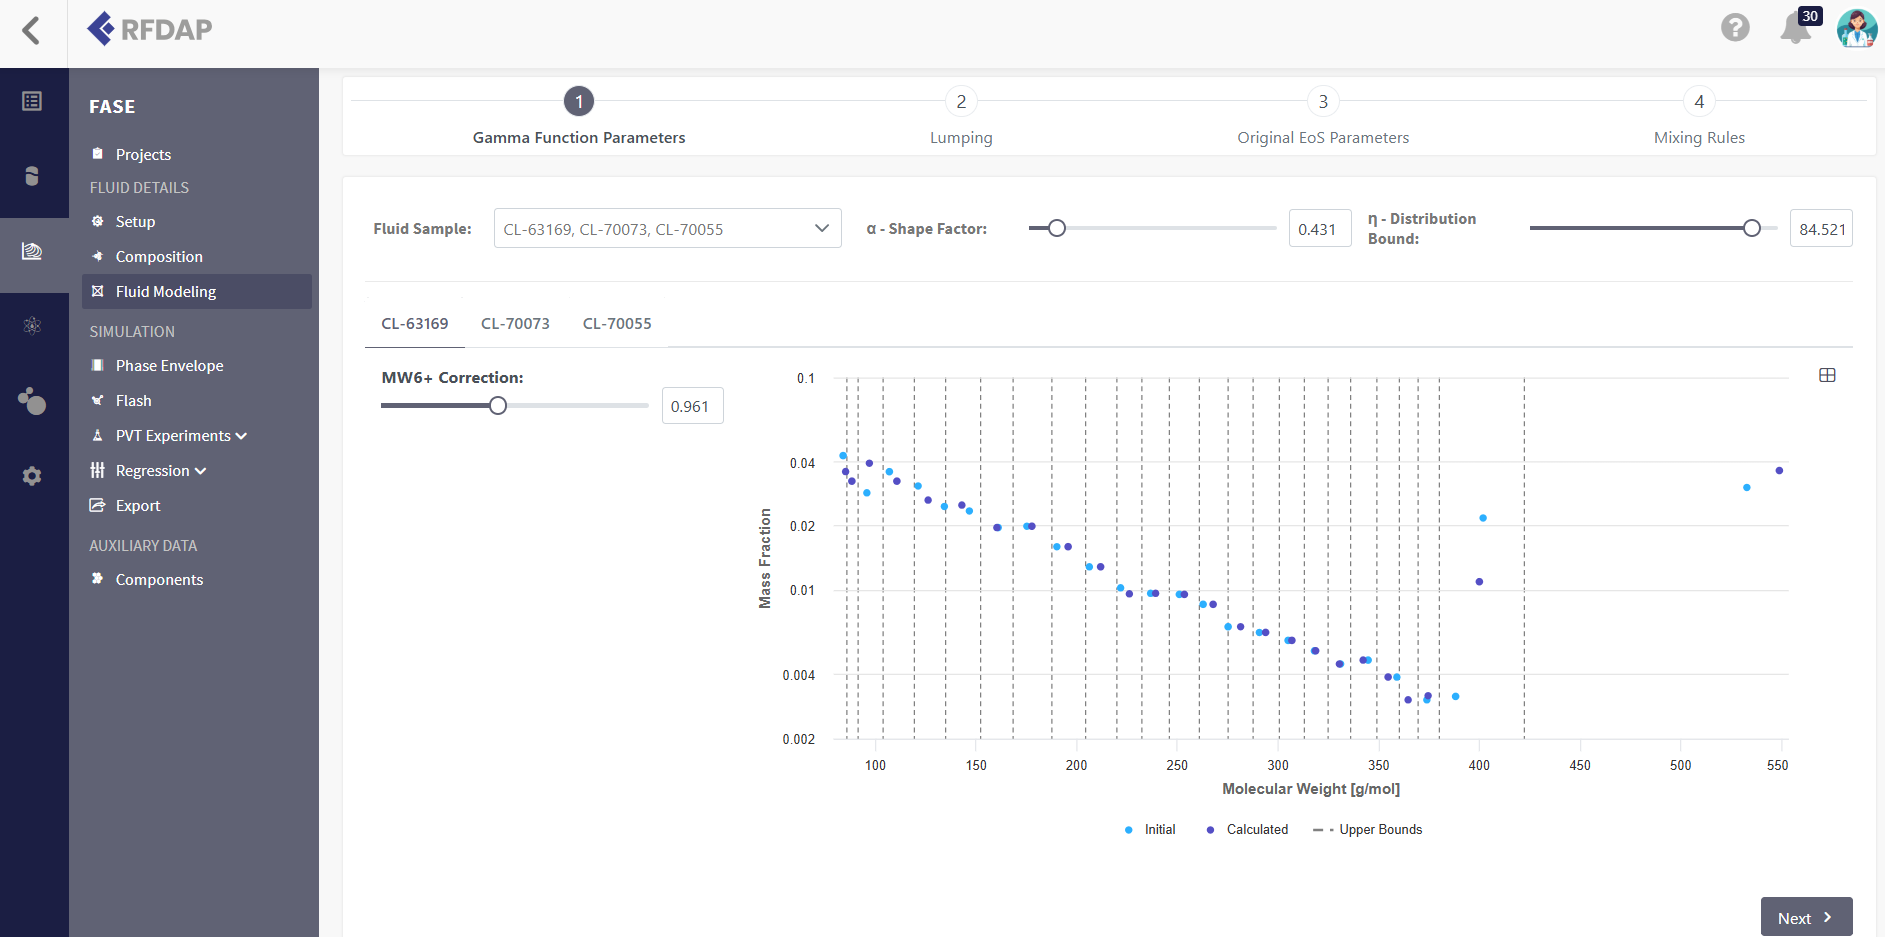
Characterizing heavy components just got more precise. The Gamma Function approach is designed to calculate the molecular weight (Mw) of heavy fractions based on the average molecular weight of the sample. This effectively optimizes the Mw of the heavy fractions to the specific oil sample, better reflecting the oil’s unique fingerprint. Furthermore, while these parameters are automatically calculated, you can also manually adjust them. This flexibility allows for expert fine-tuning to better align the model with specific experimental data or known reservoir trends.
As the component distribution within the same heavy fraction can vary significantly between different crude oils, this customization leads to more realistic Mw values and a more accurate characterization of the plus fraction, as shown in Figure 3.
Building on our existing framework, we have enhanced the interface of gas compositions for Multi-stage Separator and Differential Liberation (DL) experiments for each pressure stage. The system also supports saving the average density and molecular weight for the gaseous phases, as shown in Figure 4.

You can now define your streams with even greater detail by saving laboratory measurement values directly within each stream. These metrics serve as a reference during study configuration. The available input options dynamically adjust based on the stream type:

Version 2025.3.1
Catalogue
FASE
SCAS
STEPS
Version 2025.4
Catalogue
– Fixed Data Persistence in Equipment Details
– Fixed Curve Chart in Chromatography Experiment


